
Содержание
Between late 2025 and early 2026, something significant happened in the global semiconductor industry.
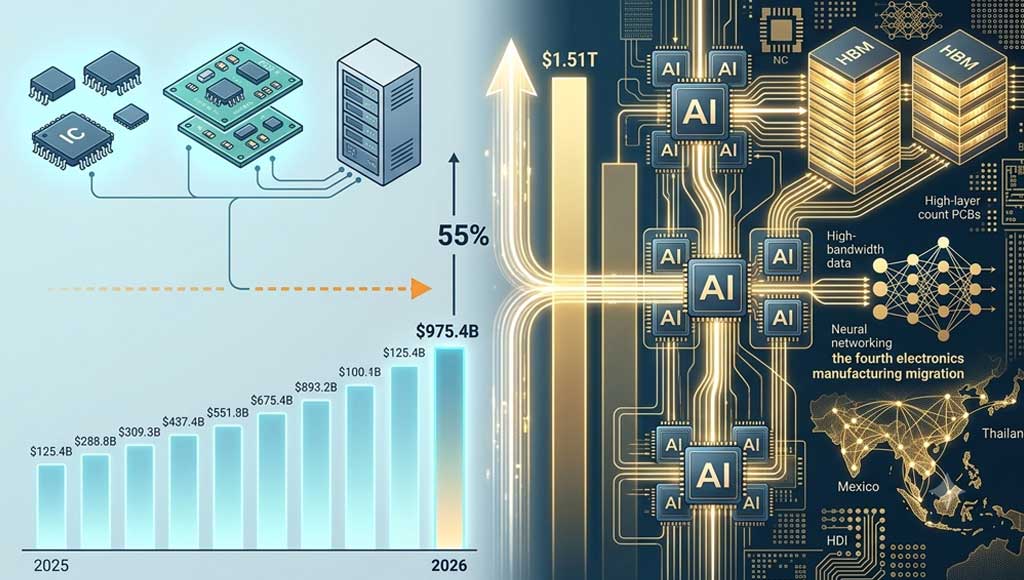
In December 2025, the World Semiconductor Trade Statistics (WSTS) forecast the 2026 global semiconductor market at $975.4 billion. Just six months later, that figure was revised upward to $1.51 trillion – a 55% upward revision, representing 90% year‑on‑year growth.
This is not a cyclical recovery. This is a structural restructuring.
1. Global Semiconductor Market: Not a Recovery, but a Restructuring
2025 in review:
Global semiconductor sales reached $791.7 billion, up 25.6% YoY.
- Asia‑Pacific & others: +45.0%
- Americas: +30.5%
- China: +17.3%
- Europe: +6.3%
- Japan: –4.7%
Logic semiconductors grew 39.9% to $301.9B; memory grew 34.8% to $223.1B.
2026 outlook (WSTS, mid‑2026 revision):
| Region | 2025 Actual | 2026 Forecast | YoY Growth |
|---|---|---|---|
| Americas | $251.9B | $543.6B | +115.8% |
| Asia Pacific | $421.4B | $823.9B | +87.4% |
| Europe | $54.1B | $67.5B | +24.8% |
| Japan | $44.8B | $57.9B | +29.2% |
| Global Total | $772.2B | $1,510B | +90.0% |
By product category (2026 forecast):
| Category | 2025 | 2026F | YoY |
|---|---|---|---|
| Memory | $211.6B | $800B+ | ~+250% |
| Logic | $295.9B | $405.3B | +37% |
| Analog | $85.6B | $92.0B | +7.5% |
| Micro | $84.8B | $96.6B | +13.9% |
| Discrete | $30.9B | $33.4B | +8.2% |
| Optoelectronics | $42.6B | $45.0B | +5.7% |
| Sensors | $20.9B | $22.7B | +8.7% |
Key insight: AI semiconductors (processors, HBM, networking) accounted for nearly one‑third of 2025 sales. With AI infrastructure spending expected to exceed $1.3 trillion in 2026, AI chips will make up over 50% of total semiconductor sales by 2029 (Gartner).
The growth is highly uneven – HBM, advanced logic, advanced packaging, and high‑speed interconnects are redefining pricing and capacity. General‑purpose mature devices still depend on inventory and real end‑demand.
2. China Market: Moving Up the Value Chain
2025 performance:
- Electronic information manufacturing revenue: RMB 17.4 trillion (+7.4%)
- IC production: 484.3 billion units (+10.9%)
- IC exports: **$201.9 billion** (+26.8%) – first time exceeding $200B, the largest single export category.
| Year | Export Volume (B units) | YoY | Export Value ($B) | YoY |
|---|---|---|---|---|
| 2020 | 259.8 | +17.5% | 116.6 | +14.8% |
| 2021 | 310.7 | +19.6% | 144.0 | +23.5% |
| 2022 | 273.4 | –12.0% | 135.0 | –6.3% |
| 2023 | 267.0 | –2.3% | 134.5 | –0.4% |
| 2024 | 298.1 | +11.6% | 159.6 | +18.1% |
| 2025 | 349.5 | +17.4% | 201.9 | +26.8% |
First half of 2026 (H1):
- IC exports (USD): $177.28 billion, up 96.1% YoY
- IC production: 279.8 billion units, up 23.1% (over 1.5B per day)
- Investment in IC manufacturing grew 8.8% among high‑tech industries.
Regionally, the share of China’s IC exports to Southeast Asia rose from 15% in 2020 to 31% in 2024, reflecting supply chain shifts.
3. Key Product Categories
PCB – AI‑Driven Super Cycle
- 2025 global PCB market: $84.89 billion
- 2026 forecast (Prismark): $95.8 billion (+12.5%)
- Expected to exceed $100 billion in 2027.
| Segment | 2025 | 2026F | YoY |
|---|---|---|---|
| Total PCB Market | $84.9B | $95.8B | +12.5% |
| AI‑Server PCB & Substrates | $9.1B | $15.6B | +71.4% |
| AI Share of Total | 11% | 16% | – |
Goldman Sachs projects global AI server PCB from $3.1B (2024)** to **$27.1B (2027), with 113% and 117% YoY growth in 2026 and 2027.
High‑layer boards, HDI, and IC substrates are the main growth drivers.
Sensors & IoT – 5G + AIoT
- IoT devices expected to exceed 25.4 billion by 2030 (Strategy Analytics).
- CAGR for IoT cellular connections (2022‑2030): 14%.
- China to account for 26% of global IoT economic value by 2030 (McKinsey).
- China sensor market (2021): RMB 295.2 billion, +17.6%.
- Domestic players are moving from mid‑low end to high‑end sensors.
4. Industry Migration – The Fourth Wave
The world is in the fourth electronics manufacturing migration. China faces the “two‑way squeeze” – high‑end manufacturing returning to the US/Europe, and labour‑intensive production moving to Southeast Asia.
However, the opportunity lies in the fact that most receiving countries lack complete ecosystems. China is increasingly exporting components, modules, and design services rather than finished goods.
| Country/Region | Signal |
|---|---|
| Vietnam | Local procurement rights emerging; component accessories exports up 459%. |
| Mexico | Early stages of localisation – potential for future growth. |
| Thailand | PCB output expected to reach $6.09B in 2026 (+20.4%). |
This migration is reshaping regional component demand, with the Americas and Asia‑Pacific growing fastest.
5. Three Signals Worth Watching
Signal 1 – AI re‑stratifies the industry
Not all chips rise – only those in the AI supply chain. HBM, advanced logic, and packaging command premium pricing. Mature nodes still face inventory pressure.
Signal 2 – China’s export mix is shifting
Mobile phones and computers are declining; ICs and modules are surging. The value chain is moving from assembly to design and high‑value components.
Signal 3 – Global supply chains are redistributing
Southeast Asia and Mexico are building local procurement. This creates new demand for Chinese components and semi‑finished goods, but also challenges in logistics and compliance.
Реальность инженерного дела
2026 is not a recovery year – it is a restructuring year.
- AI is rewriting the growth logic of semiconductors.
- China is moving from finished‑goods exporter to component and module supplier.
- The fourth migration is changing where and how components are procured.
For industry professionals, understanding these structural shifts is far more valuable than tracking short‑term price fluctuations.
Data sources for this article: WSTS, Gartner, General Administration of Customs of China, Ministry of Industry and Information Technology, Prismark, Alibaba.com 2026 Electronic Components Industry Trends and Strategy Report.